As we move into what is traditionally the close of our severe weather season in late August for Colorado – I’ve been cruising around the data coming in for the year and some of the journals from meteorologists to see what’s going on with tornadoes this year. A few interesting things have come up with tornado climatology, not just across the U.S. but in Colorado as well.
I’ll highlight a few of those below!
Tornado Data for 2021
Short Term Data 2021
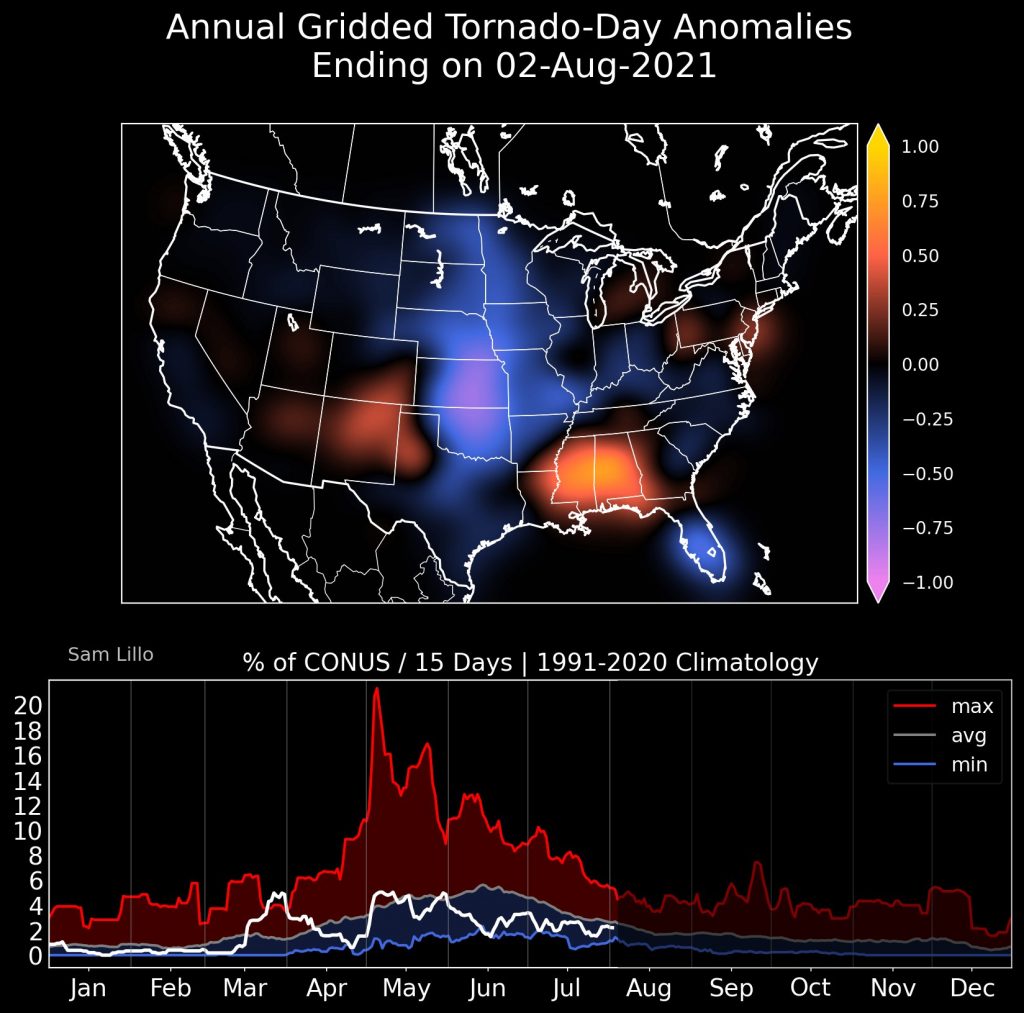
The graphic below is a look at which areas across the United States experienced above average or below average numbers of tornadoes based on their location. The details are interesting as areas int he Southeast have seen above average tornadoes for the year along with the Southern plains including Texas, New Mexico and even Southeastern Colorado.
As you can see though, the overall number of tornadoes vs the climatological average is lower than average for much of the season. The exception being earlier in the year during March and April. What does this tell us? We cannot make an assumption on longer term weather or climate (or even climate change) based on one year’s worth of data… that’s not how it works. One quiet year, or even several is not enough data for us to determine any definitive changes in the pattern, atmosphere or climate. I’ll write another article detailing longer term trends and patterns across the United States if there’s interest!
Colorado Tornado Counts
Long term (last 50 plus years)
If we zoom into Colorado more specifically, we can get a better picture of if/how our severe weather is changing across the state – in this case specifically tornadoes. Are we seeing more? Are we seeing less, are certain areas seeing more or less? Luckily there’s a ton of great data out there to help us answer this question. There’s a great article on The American Meteorological Society with a lot of great data, figures and explanation.
An Updated Severe Hail and Tornado Climatology for Eastern Colorado
Credit: An Updated Severe Hail and Tornado Climatology for Eastern Colorado Samuel J. Childs1 and Russ S. Schumacher1
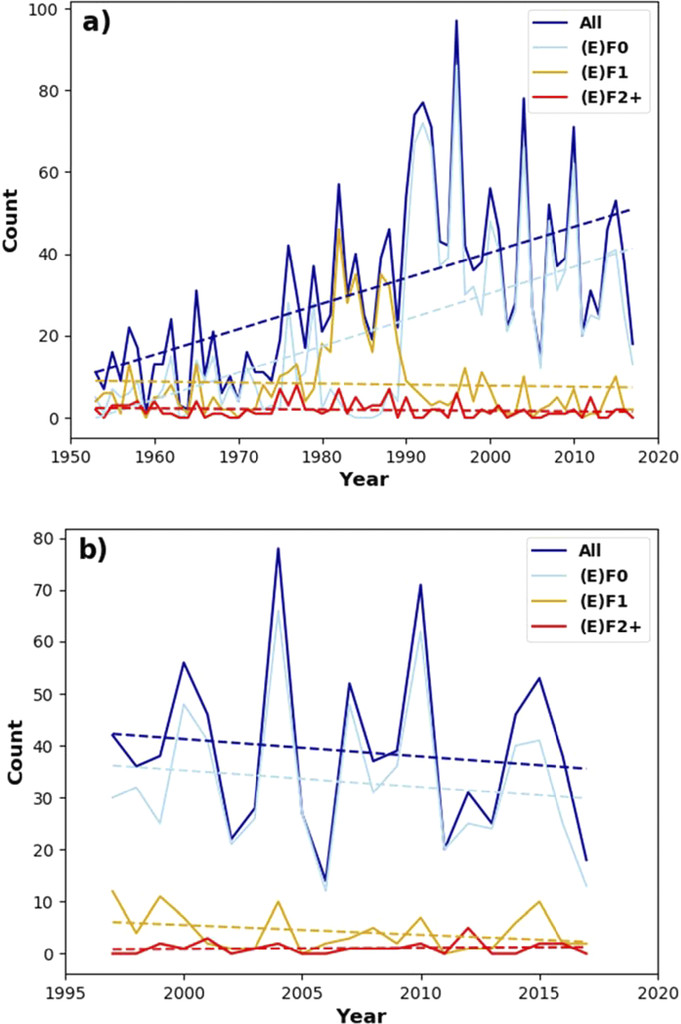
Figure A is tornado counts in Eastern Colorado from 1953 – 2017
When we take a look at this graph, we see that tornado counts overall are up quite a bit over the time period, but mainly with smaller and weaker tornadoes. Everything at an (E)F1 or higher intensity has declined slightly or remains fairly flat. I’d have to dig deeper into this, but I do wonder here that if an explosive increase in population in Colorado over the past 50 years has more to do with the inflated tornado numbers versus somethign different the atmosphere is doing. It’s an interesting thing to ponder…
Figure B is tornado counts in Eastern Colorado from 1997 – 2017
Looking at this graph of just the last 10 years from 2017 shows a downward trend in total numbers of tornadoes across the board.
Other Interesting Points to Note
- 96% of all tornadoes in Colorado are rated non-significant (EF0 or EF1) – big tornadoes are EXTREMELY RARE in Colorado – this has not changed in the last 50 or 10 years.
- The only tornado rated higher than an (E)F3 was an F4 in Baca County in 1977 – however, this tornado started in Oklahoma so it is/is not counted depending on who you talk to
Overall Counts of Tornadoes in Colorado are down in the past 10-12 years – but variability still remains year to year. Overall tornado counts are up over the past 50 years, still a lot of debate on whether this is due to population growth or better radar technology
We have also not seen any statistically significant uptick in large or violent tornadoes in Colorado
Colorado’s Tornado Alley Shifting?
Credit: An Updated Severe Hail and Tornado Climatology for Eastern Colorado Samuel J. Childs1 and Russ S. Schumacher1
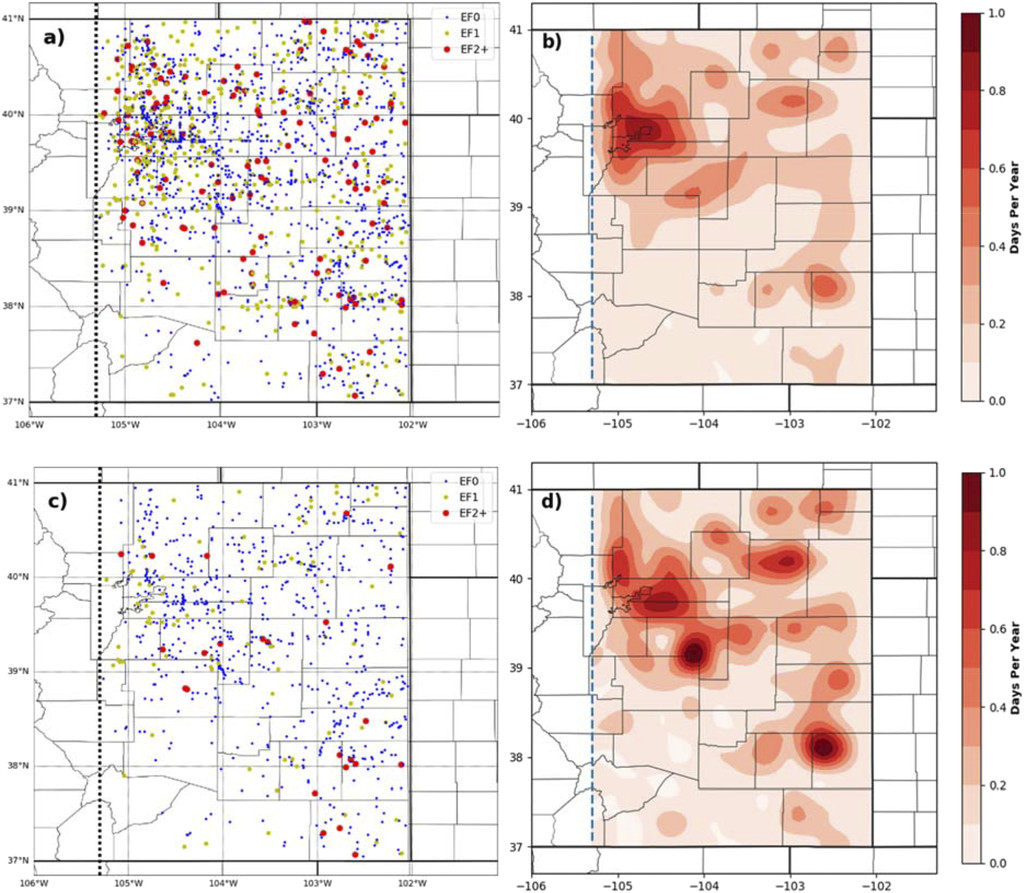
Figure A and B is tornado days per year in Eastern Colorado from 1953 – 2017
Figure C and D is tornado days per year in Eastern Colorado from 1997 – 2017
I’ll discuss all 4 of these together because they are not necessarily showing a shift in tornado activity across Eastern Colorado, it appears they are more just solidifying the data we’ve had for years. The figures I want you to pay most attention to are B and D – these are smoothed out to somewhat account for population bias and erroneous reports. You can see the hotspots for tornadoes being the Northern Urban corridor up against the foothills, the area in and around Denver International Airport and the Palmer Divide especially in Elbert County. If you’ve lived here long enough, none of this should surprise you. The paper specifically mentions the Palmer Divide for an area of convergence resulting in a lot of weak tornadoes (land spouts/ non-mesocyclonic.) None of these areas have appeared to shift location in the 1953-2017 data or the 1997-2017 data, but have been better refined over the years and the short term data confirms the longer term pattern.
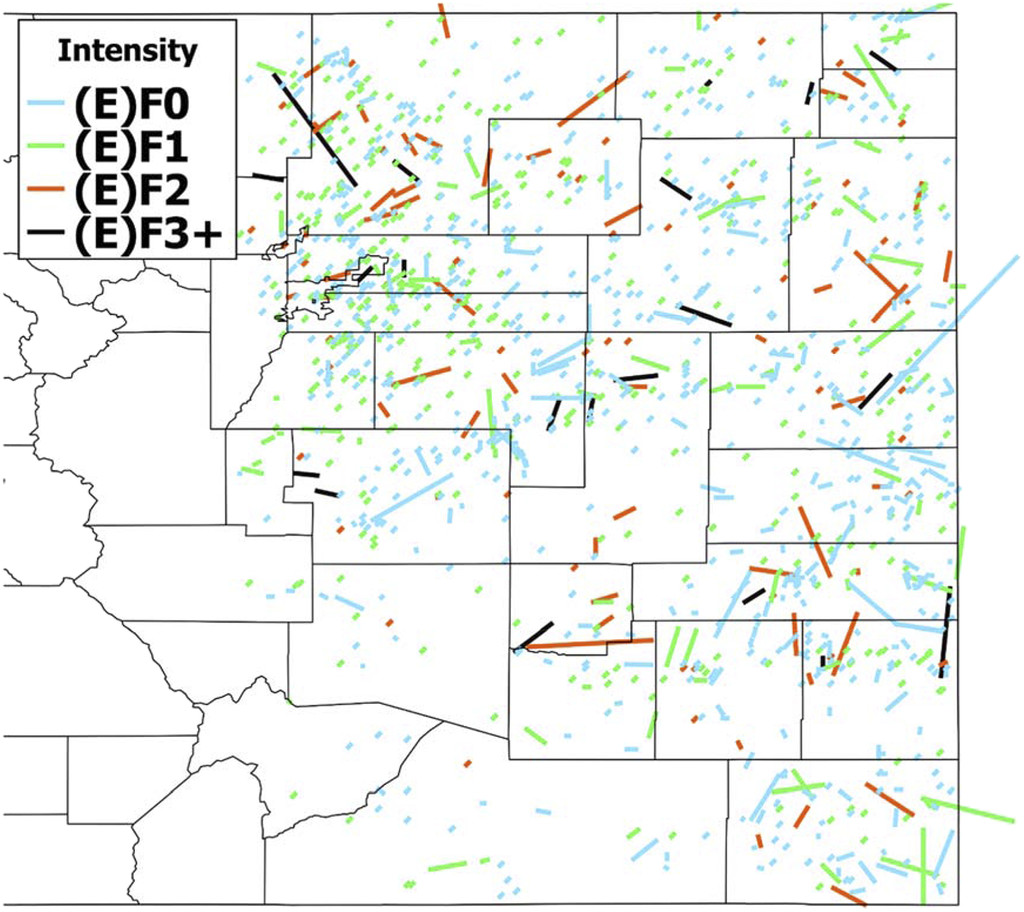
Here’s a map of tornadoes and tracks in Colorado from 1953-2017
I always love maps like this because it helps visualize who has seen what. A couple of interesting notes for close to home locations on the Palmer Divide:
- Douglas County is no stranger to tornadoes but nearly all of them have been quite weak… only 2 (E)F2’s have been recorded
- Elbert County is fairly active for tornadoes with several (E)F2’s and even one (E)F3 recorded
- El Paso county also sees its fair share of tornado activity
A Few Other Colorado Tornado “Did You Knows?”
Data from: Climatology of Colorado Tornadoes by Chris Spears
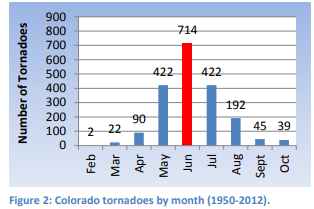
You’re most likely to see a tornado in May or June
Want to see a tornado in Colorado? Your best shot is in May or June. July is very close and is no stranger to tornadoes but the atmosphere is better set up for strong severe thunderstorms in May and June, while July can see weak spin-ups associated with monsoon thunderstorms.
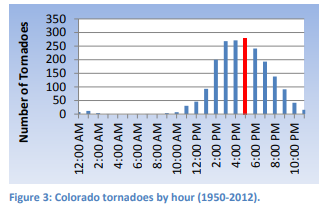
You’re most likely to see a tornado between 2-6PM
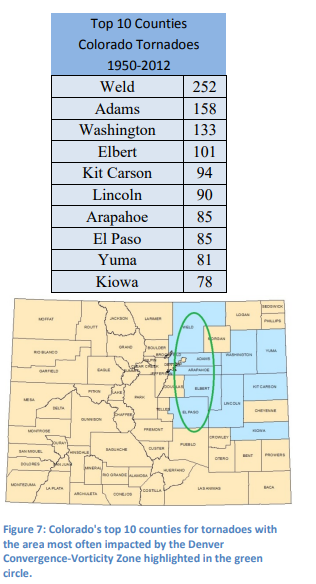
Top Counties You’re Most Likely To See A Tornado In
Weld and Adams Counties take the cake for total numbers of tornadoes in Colorado and both are in the top 3 for all of the United States!
If you’d prefer to chase a tornado a bit closer to home and live along the Palmer Divide, Elbert and Arapahoe Counties are your best bet!
Any Other Weather Topics You’d Like to See on an Upcoming “Weather Wednesday?”
Be sure to let us know!


