One of the more challenging forecasts I've had to deal with this year. This storm through the models for a loop with bouncing back and forth between no snow at all to a full on high snow accumulation event with wind A.K.A a blizzard. Despite the challenges I do think our forecast turned out pretty well, the actual snowfall ranges we had vs. the ones we predicted came out pretty well! The impacts we had forecast, including difficult travel conditions due to snowfall and strong winds verified as well.
Here's all the details of how this storm finished and note about how the models handled it!
MountainWave Weather Snowfall Forecast Vs. Outcome
These are official NWS measurements reported as of 7AM this morning. Due to the spotty nature of the heavy snowfall band and the amount of wind, amounts may vary across a short distance. These numbers may not match what you see in your area exactly, but these are the official measurements that will go in the record books, so I'll count them.
Legend: [Verified Within Forecast Range] [Close to Forecast Range (+/- 1-2 inches of accumulation] [Minor Forecast Bust (+/- 2-4 inches of accumulation] [Major Forecast Bust (+/-4 inches or more/less accumulation]
| City | 24-48 hour Forecast Range | Within 12-24 hour Forecast Range | Actual Amount |
|---|---|---|---|
| Castle Rock | 0-2 | 3-6 | 6.0 |
| Parker | 0-2 | 3-6 | 3.0 |
| Highlands Ranch | 0-2 | 2-5 | 3.5 |
| Elbert | 2-4 | 2-5 | 2.5 |
| Elizabeth | 2-4 | 2-4 | 3.6 |
| Kiowa | 2-4 | 2-4 | -- |
| Centennial | 0-2 | 2-4 | 4.0 |
| Denver | 0-2 | 2-4 | 2.0 |
| Larkspur | 1-3 | 3-6 | -- |
| Monument | 1-3 | 2-4 | 8.5 |
| Black Forest | 2-5 | 2-5 | 6.5 |
| Littleton | 0-2 | 1-3 | 2.5 |
**Kiowa and Larkspur had no reports. They are not included in the forecast evaluation below.
- Overall Forecast Range Recap:
- 8 out of 10 verified
- 0 out of 10 were very close to forecast range
- 1 were minor busts
- 1 were major busts
- Grade of this forecast: GOOD
Despite the model uncertainty I think our forecast ended up pretty well for most areas. I imagine some areas busted a bit high or low, depending on where you measured and what the topography was like around you. Overall, we were pretty spot on to the official measurements.
**Note: the major bust for Monument is only the second of the snow season so far this year and was not the biggest. Only being off by 4.0 inches, the largest snowfall forecast bust was during the 11/26/2019 storm where Monument recorded a whopping 7.0 inches above my forecast range. Again that was Monument! I'll have to keep an eye on you guys down there!
Interpolated 48 Hour Snowfall Maps
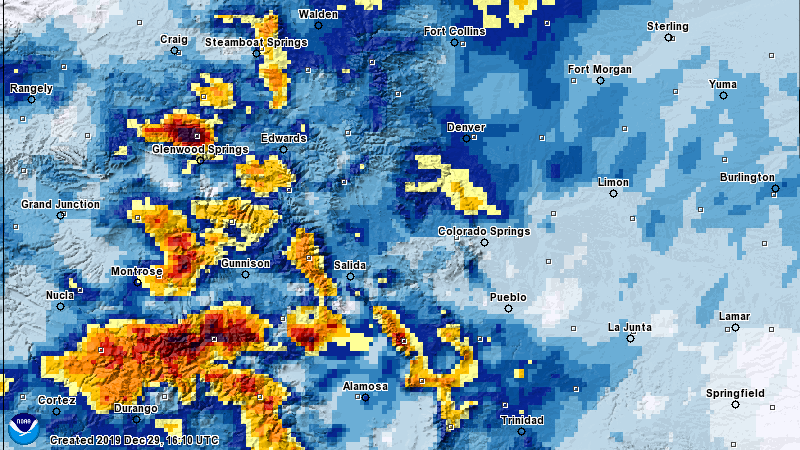
Colorado 48 hour interpolated snowfall map
As expected the Southwestern Mountains were the winners for snowfall from this storm. This was the one thing models did agree on and it panned out. Don't give them too much credit though, forecasting the storm before it crosses the mountains is much easier than when it crosses over to the Eastern plains. It's a win, but an easy one on their part.
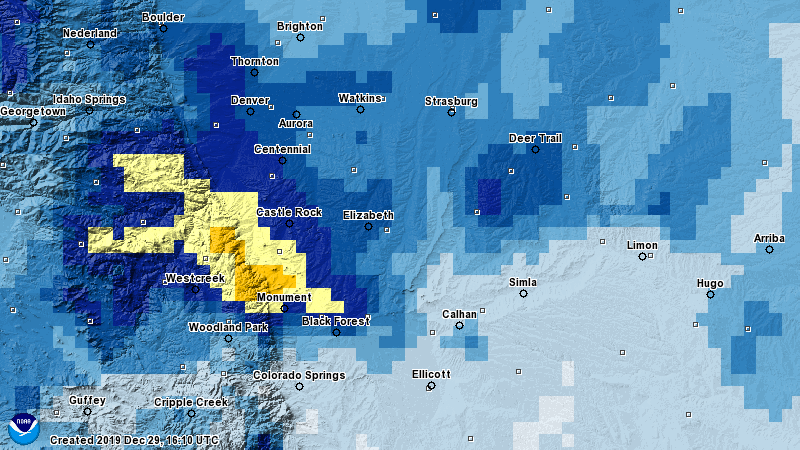
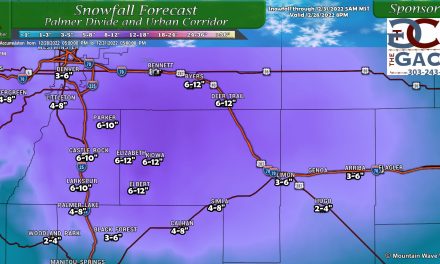
Palmer Divide Region 48 hour interpolated snowfall map
Models did paint the picture of the Palmer Divide getting the lion's share of snow but they struggled with overall amounts. Some areas saw more than forecast and some less. It really came down to where the heavy snowfall band set up shop and as we know models are notoriously bad at predicting that.
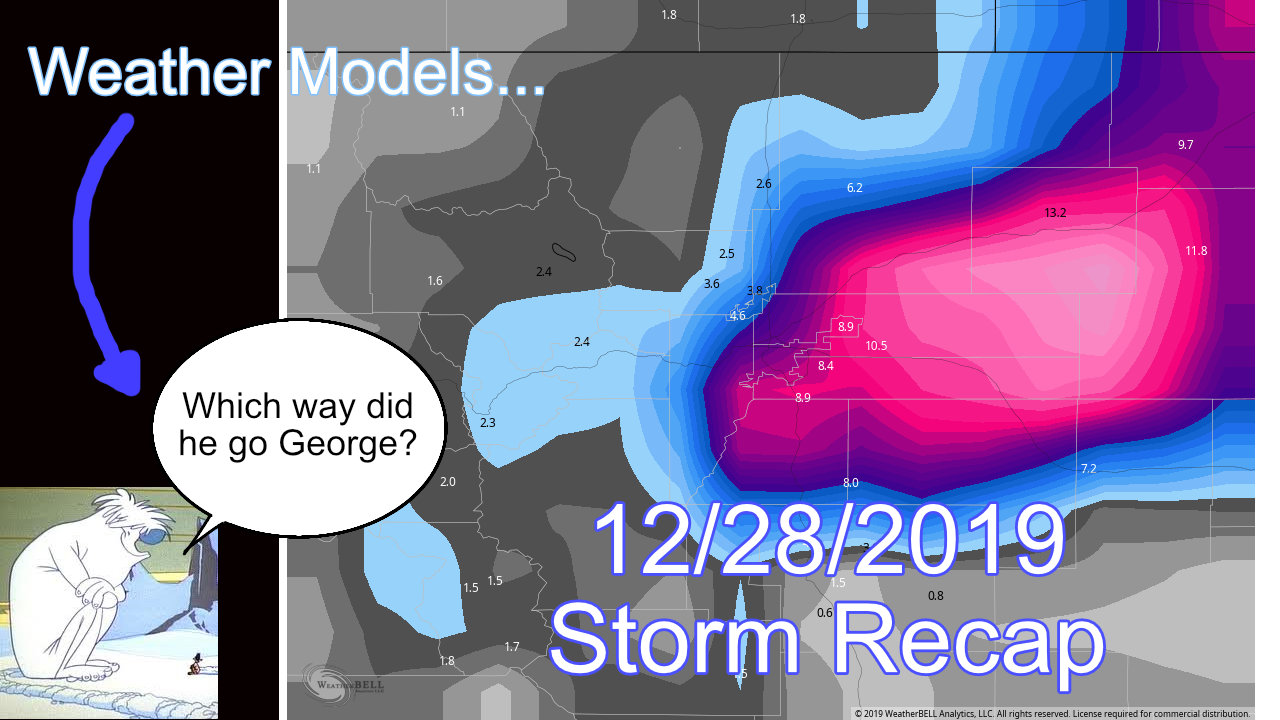
Models Struggle With Snowfall On This Storm
I think the models did ok with the snowfall amounts on this storm once we got closer but more than 24 hours out they were really struggling. We had everything from this:
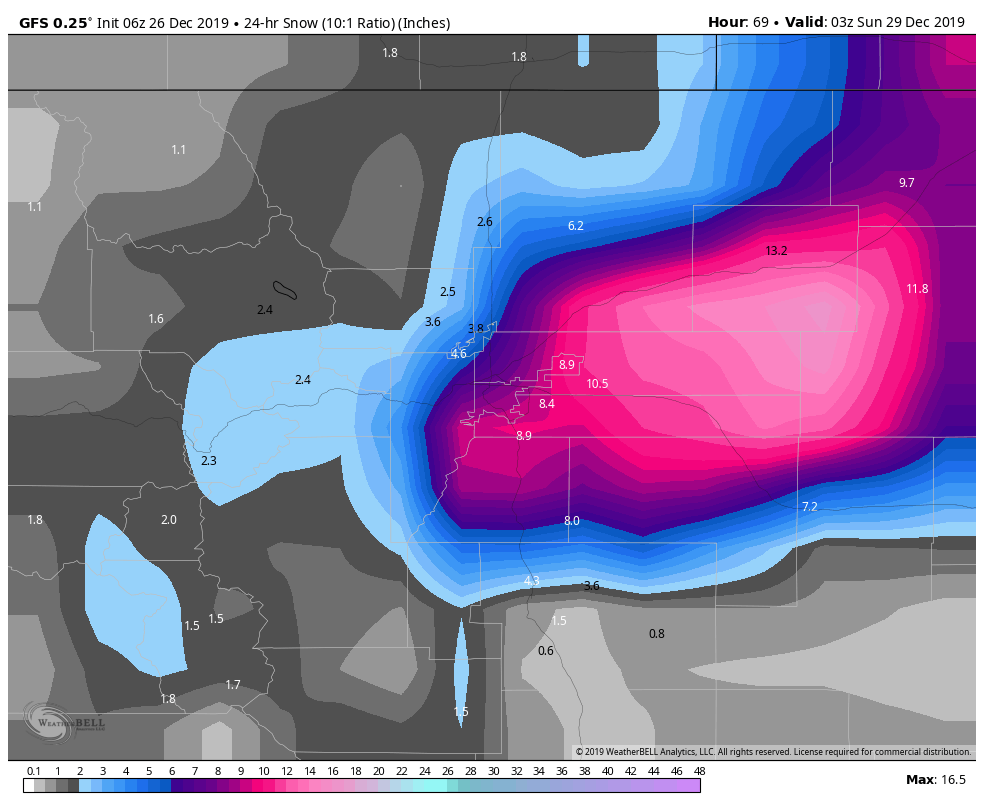
GFS was doing its thing about 60 hours out...
To this:
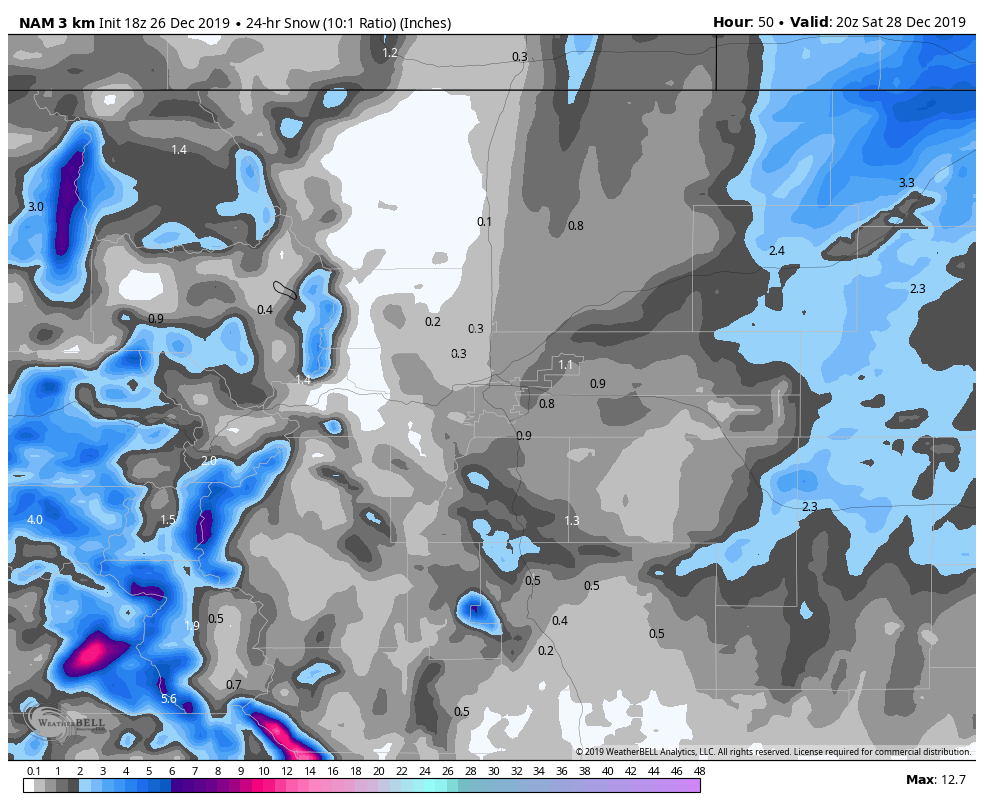
Nam3K was generally ok on areas of heavier snowfall, but didn't do well on snowfall amounts.
As usual the GFS wasn't much of help especially more than a day or two out. When the Nam3K finally came into range it had a spread of snowfall totals all over the place and didn't particularly nail anything in terms of accumulation or location.
Interestingly the Euro did pretty well a ways out with location but was pretty off on snowfall...
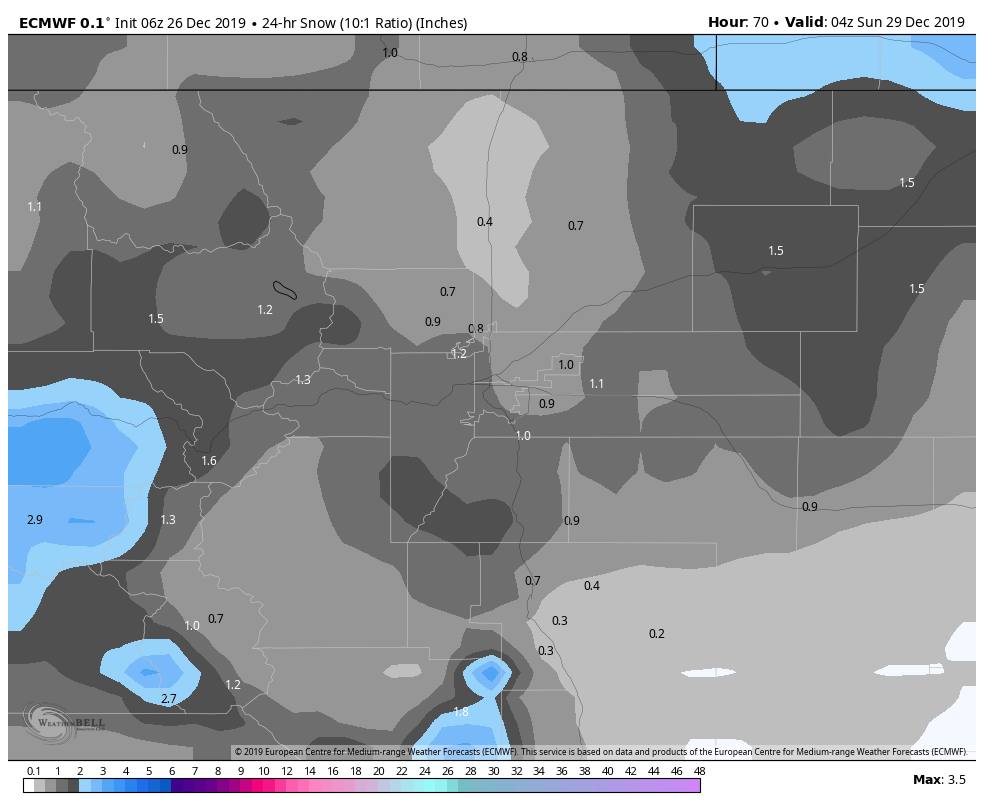
Euro predicted snowfall +70 hours out. Notice it picked up on the heavier locations of snowfall pretty well but didn't get the amounts close at all.
The winner I suppose... and I can't believe I'm saying this was the Canadian. It was closest in terms of location of heavier snow and closest to snowfall amounts.
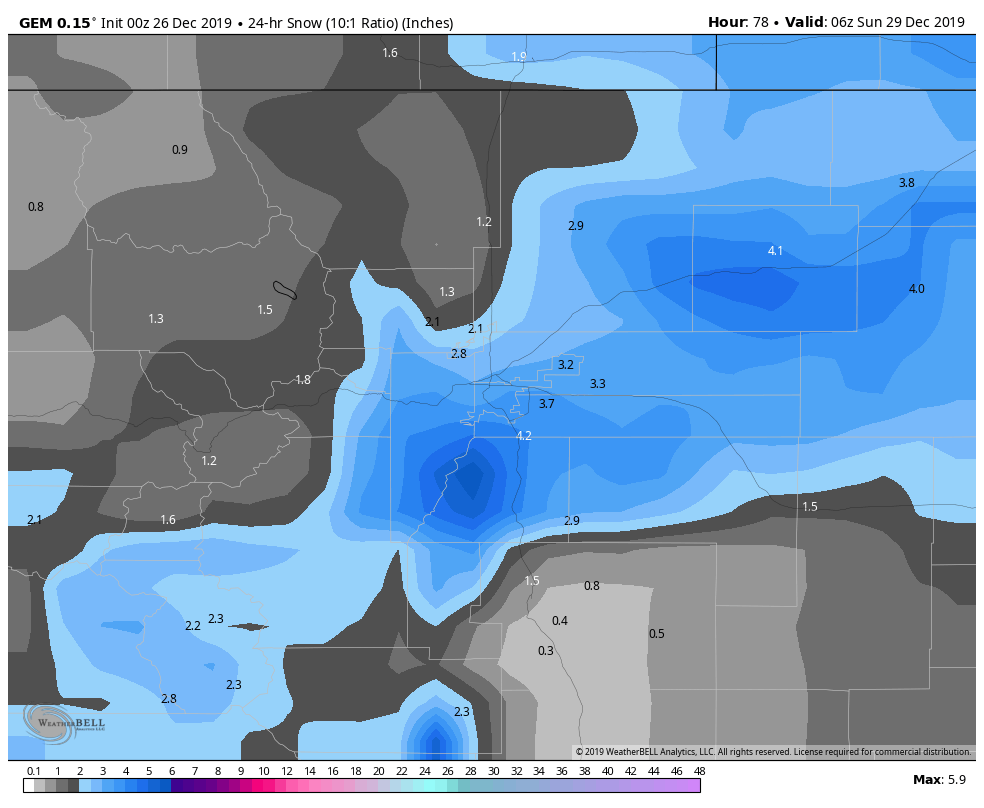
Canadian model was probably the closest on this storm...
How do you put together a decent forecast when the models are all over the place? It can still be done, it's just a lot more challenging. You have to do a bit more "meteorology" than you normally would. That's perhaps a story for another day, but the short of it is you tend to be watching the satellite imagery very closely and comparing that with where the models were predicting it would go. It helps you spot wobbles to the North or South easier but it also helps you keep tabs on the strength of the storm.
Summary
Not a bad storm to end the year with. Certainly not the biggest snowfall event of the year, but given that we were virtually dry through most of December, this helps tremendously.
I'll have to run all the numbers when the come in, but given the tiny storm we had around the middle of the month plus what we just had; I imagine we will not make average snowfall for many areas along the Palmer Divide. My rough guess is we had about 7 inches of snow total for the month in Castle Rock. With the average being 11 inches, that means we won't make it... this would be the first time since September we've seen a month with below average snowfall.
Not much to fret about yet, there's a lot of snow season left. Stay warm, stay safe and have a great Sunday!
