
Summary
We’ll be honest, June 2017 turned out quite a bit different from what we expecting for some areas of the forecast. While we expected the temperatures to be above average, we were thinking they’d only be slightly so; in reality they finished quite a bit above average. The other story was the precipitation… coming off of a decently wet spring and an El Nino pattern establishing we figured above normal precipitation or at least near average. This again didn’t pan out, we’ve got the latest details on how June 2017 finished up for Castle Rock below!
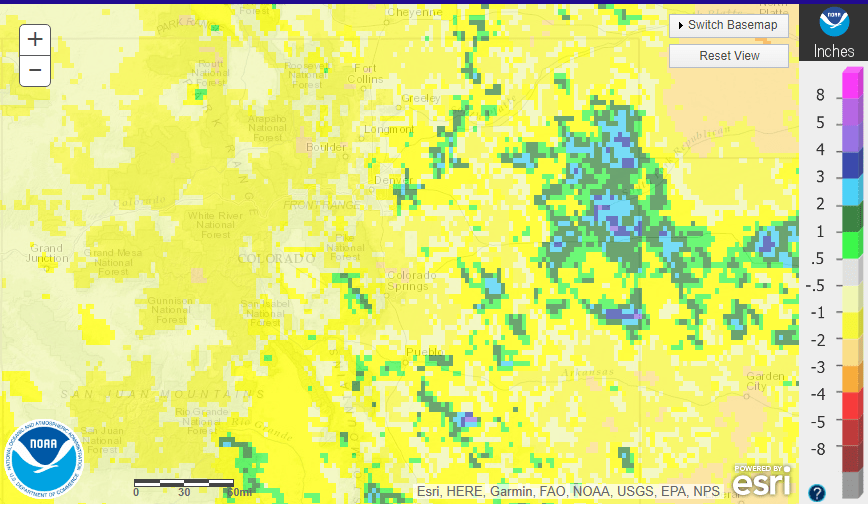
Only a few spots on the plains saw any decent rainfall, thanks mainly to severe thunderstorms. The rest of the state was between 1-2 inches below average on rain for the month! Some select areas were nearly 3 inches below average!
Temperatures
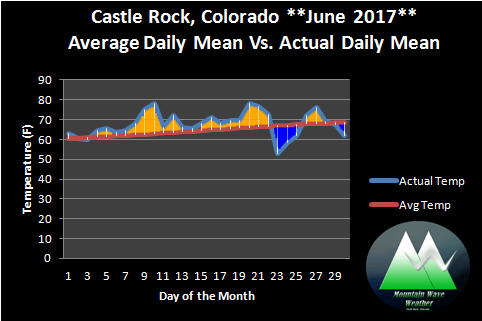
Castle Rock’s June 2017 daily mean temperatures vs. average
June 2017 wasn’t quite a scorcher of a month but it certainly was close! Nearly the entire first 3/4 of the month saw above average temperatures. We didn’t see any significant cooler days until the last week when we had a few cold fronts move through and drop the temperature. Despite the cooler finish, it couldn’t help the month from finishing well above average on overall temperatures.
The monthly mean temperature for Castle Rock finished at 67.5 degrees which is 2.90 degrees above average.
Precipitation
June is one of three months we don’t see snow in on average for the Denver and Palmer Divide area, despite a few snow showers in the uppermost elevations of the mountains this held true this year. With that we mainly had to track rain for precipitation but there really wasn’t much to track this month. June was abnormally dry for most of the Eastern part of Colorado but especially the Castle Rock area. Our station in Castle Rock recorded an abysmal 0.21 inches of precipitation for the area during June… the average is 2.05.
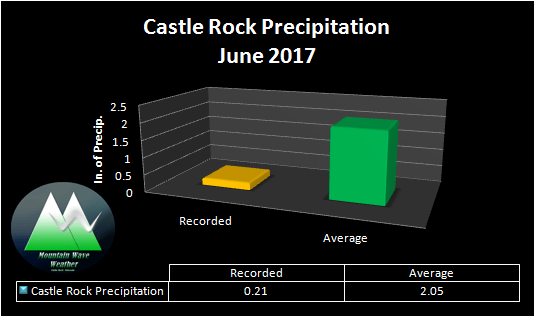
June 2017 was nearly “bone dry” across the Castle Rock area!
Total liquid precipitation for Castle Rock finished at 0.21 inches which is 1.84 inches below average.
We’ll have our July outlook and all of the official data up shortly on our
You can also view previous months dating back to 2015.
Also stay tuned for our mid-year weather update in July, we’ll take a look at how winter finished and where we are through spring and summer in 2017!

